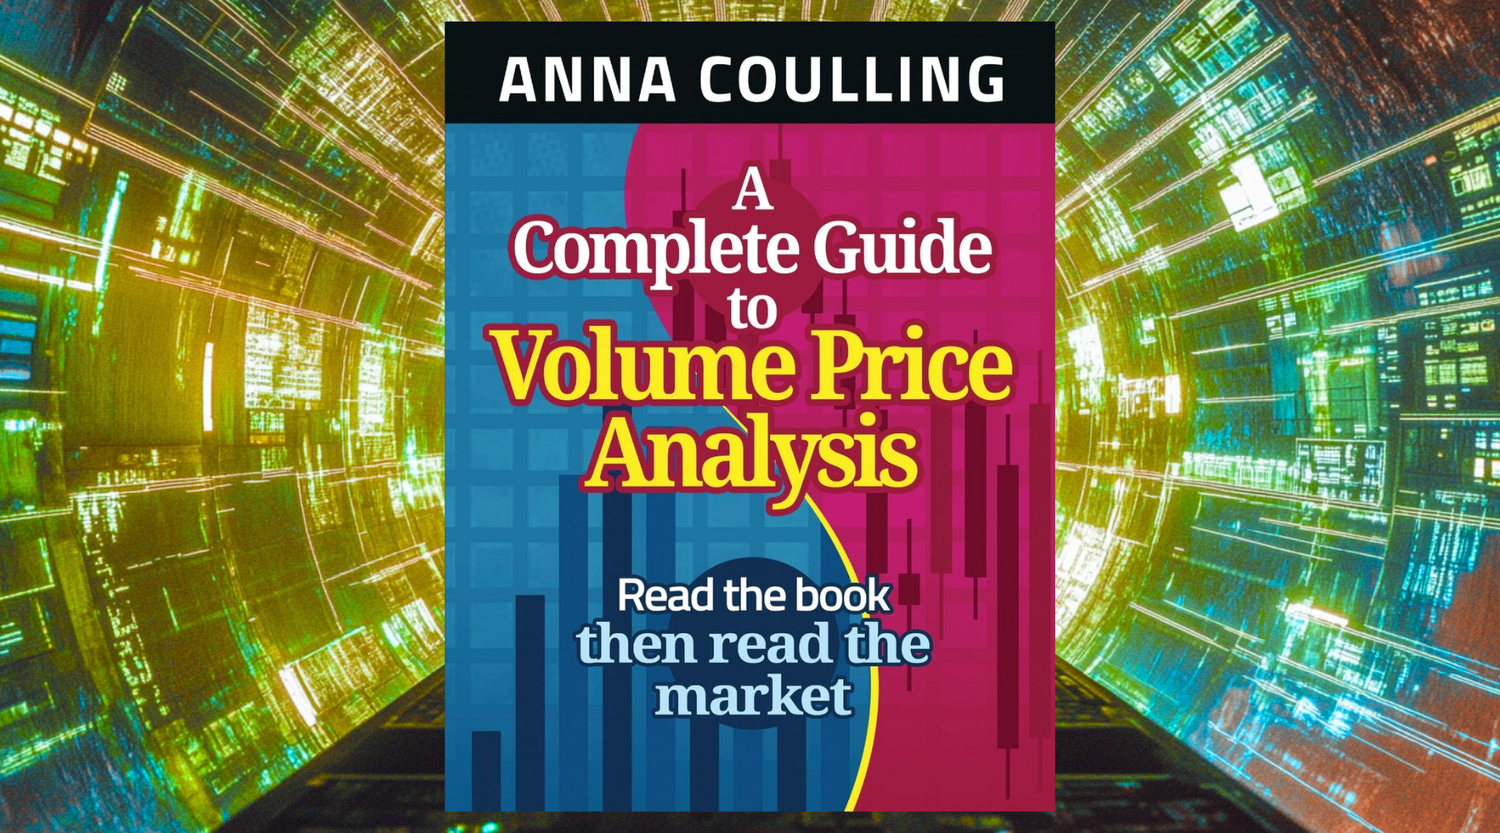
A Complete Guide to Volume Price Analysis
by : Anna Coulling
This book is a guide on how to make better trading decisions by understanding market behavior through Volume Price Analysis (VPA). This helps understand what is driving the market by analyzing what the big money players and the market makers are doing.
This is the best book I’ve ever read on the topic of Volume and Price with candlestick charts. It’s also a great resource for understanding different candles and what the different candles are really representing (long legged doji, hammer, hanging man, etc…), along with analysis of stopping volume and topping out volume.
Coulling inserts a ton of images showing exactly what is happening with different volume candles in reference to the price movements. It’s a very easy to read book but it’s not just great for beginners, it is information that every trader, on every timeframe should understand.

What is Volume Price Analysis?
Volume Price Analysis (VPA) is a method that looks at both price and volume to understand what's happening in the market and predict where prices might go. It can be used in any market and on any timeframe, making it a versatile tool for traders. VPA helps you understand market trends, spot potential reversals, and find good trading opportunities. By analyzing volume along with price, you can gain insights into supply and demand, which helps in forecasting trends. Volume shows how much conviction there is behind price moves.
A Complete Guide To Volume Price Analysis
Master the essential relationship between volume and price movement that drives all market action. Learn to read the story behind every chart through professional volume analysis techniques, identify smart money accumulation and distribution, and gain the technical edge that separates winning traders from the crowd.
View on AmazonThe book teaches you how to understand the relationship between price and volume so you can better predict where the market is headed. Price alone doesn’t tell the story of what is happening in the market, and volume alone simply just reveals interest, but doesn’t give us any other information to work off.
“It is only when volume and price combine that we have the chemical reaction which creates the explosive power of Volume Price Analysis.” ~ Anna Coulling, A Complete Guide to Volume Price Analysis
Reading Charts with Volume Price Analysis
Much of the book is dedicated to reading candles and candle pattern combinations to watch for when analyzing a chart using VPA. Most traders know these patterns and candle names, but using Volume Price Analysis we get a better grasp on being able to validate the price based on the volume.
Support & Resistance
Coulling uses an analogy of a house when illustrating support and resistance. Price bounces off floors of support and then heads up to the ceiling of resistance. She explains that there is nothing magical about these areas other than that these levels represent psychological levels of fear and greed.

“The market moves higher from the ground floor, and eventually reaches the ceiling, where it moves into sideways price congestion. At this point, the ceiling is providing an area of price resistance to any further move higher for the market. However, at some point the ceiling is breached and the market climbs through to the first floor level. What was the ceiling of the ground floor, has now become the floor of the first floor. In other words, an area of price resistance has now become an area of price support.” ~ Anna Coulling, A Complete Guide to Volume Price Analysis
This idea must be verified with volume.
Topping Out & Stopping Volume
"This is what the price action looks like as the brakes are applied by the insiders, and is generally referred to as stopping volume. As I have said many times before, the market is like an oil tanker. It never reverses on a dime for many reasons, not least because just like a supertanker it has momentum, and therefore takes time to respond, once the brakes are applied." ~ Anna Coulling, A Complete Guide to Volume Price Analysis

Market Cycles on Any Time Frame
Anna Coulling explains market cycles using the idea of insiders filling and emptying "warehouses" like a store managing its stock. Here's how it works:
- Accumulation: Insiders, like big investors, quietly buy assets when prices are low, filling their "warehouses". Prices stay steady, and there's not much action in the market.
- Markup: When demand starts to outpace supply, prices go up. More people notice and start buying, pushing prices even higher.
- Distribution: After prices have gone up a lot, insiders start selling to new buyers. Prices might stay the same or move around a bit as the market adjusts to the selling.
- Markdown: When there's more supply than demand, prices start to fall. People see the drop and start selling too, making prices go down even more. This phase can lead back to accumulation, starting the cycle over again.

Understanding these phases can be very helpful, but the charts don’t always work out like this. You need to understand how to read the volume and price action at the key levels of support and resistance within this framework.
“In many ways, it doesn’t really matter whether we believe the market manipulation aspect of price behavior or not. What is extremely important, is that you do believe in the relationship between price and volume in these phases of market behavior.” ~ Anna Coulling, A Complete Guide to Volume Price Analysis

“We can trade breakouts by defining congestion zones using pivots, then charting the price action using VPA, and finally when the breakout is validated by volume, enter any positions.” ~ Anna Coulling, A Complete Guide to Volume Price Analysis
My Take on A Complete Guide to Volume Price Analysis
Being able to analyze the relationship between price and volume is an indispensable tool for all traders of any timeframe and style. This book is suitable for beginners because of the way the book is written in an easy to follow format and also because of the personal tone of writing. But the information is suitable for even the most advanced traders to brush up on if they haven't read this book. It's especially one of my most recommended books when it comes to day trading. I don't say this about many books, but I highly recommend any traders get a copy of A Complete Guide to Volume Price Analysis.


1 comment
Excellent summary
John
Leave a comment
This site is protected by hCaptcha and the hCaptcha Privacy Policy and Terms of Service apply.